
Greetings all!
Given rapidly changing markets in the current environment, and an increase in queries from advisers, portfolio managers, commentators and media, I have decided to share one of my regular tools to track key market barometers and drivers of global investment markets. This is something I do anyway in order to keep track of what’s going on and why.
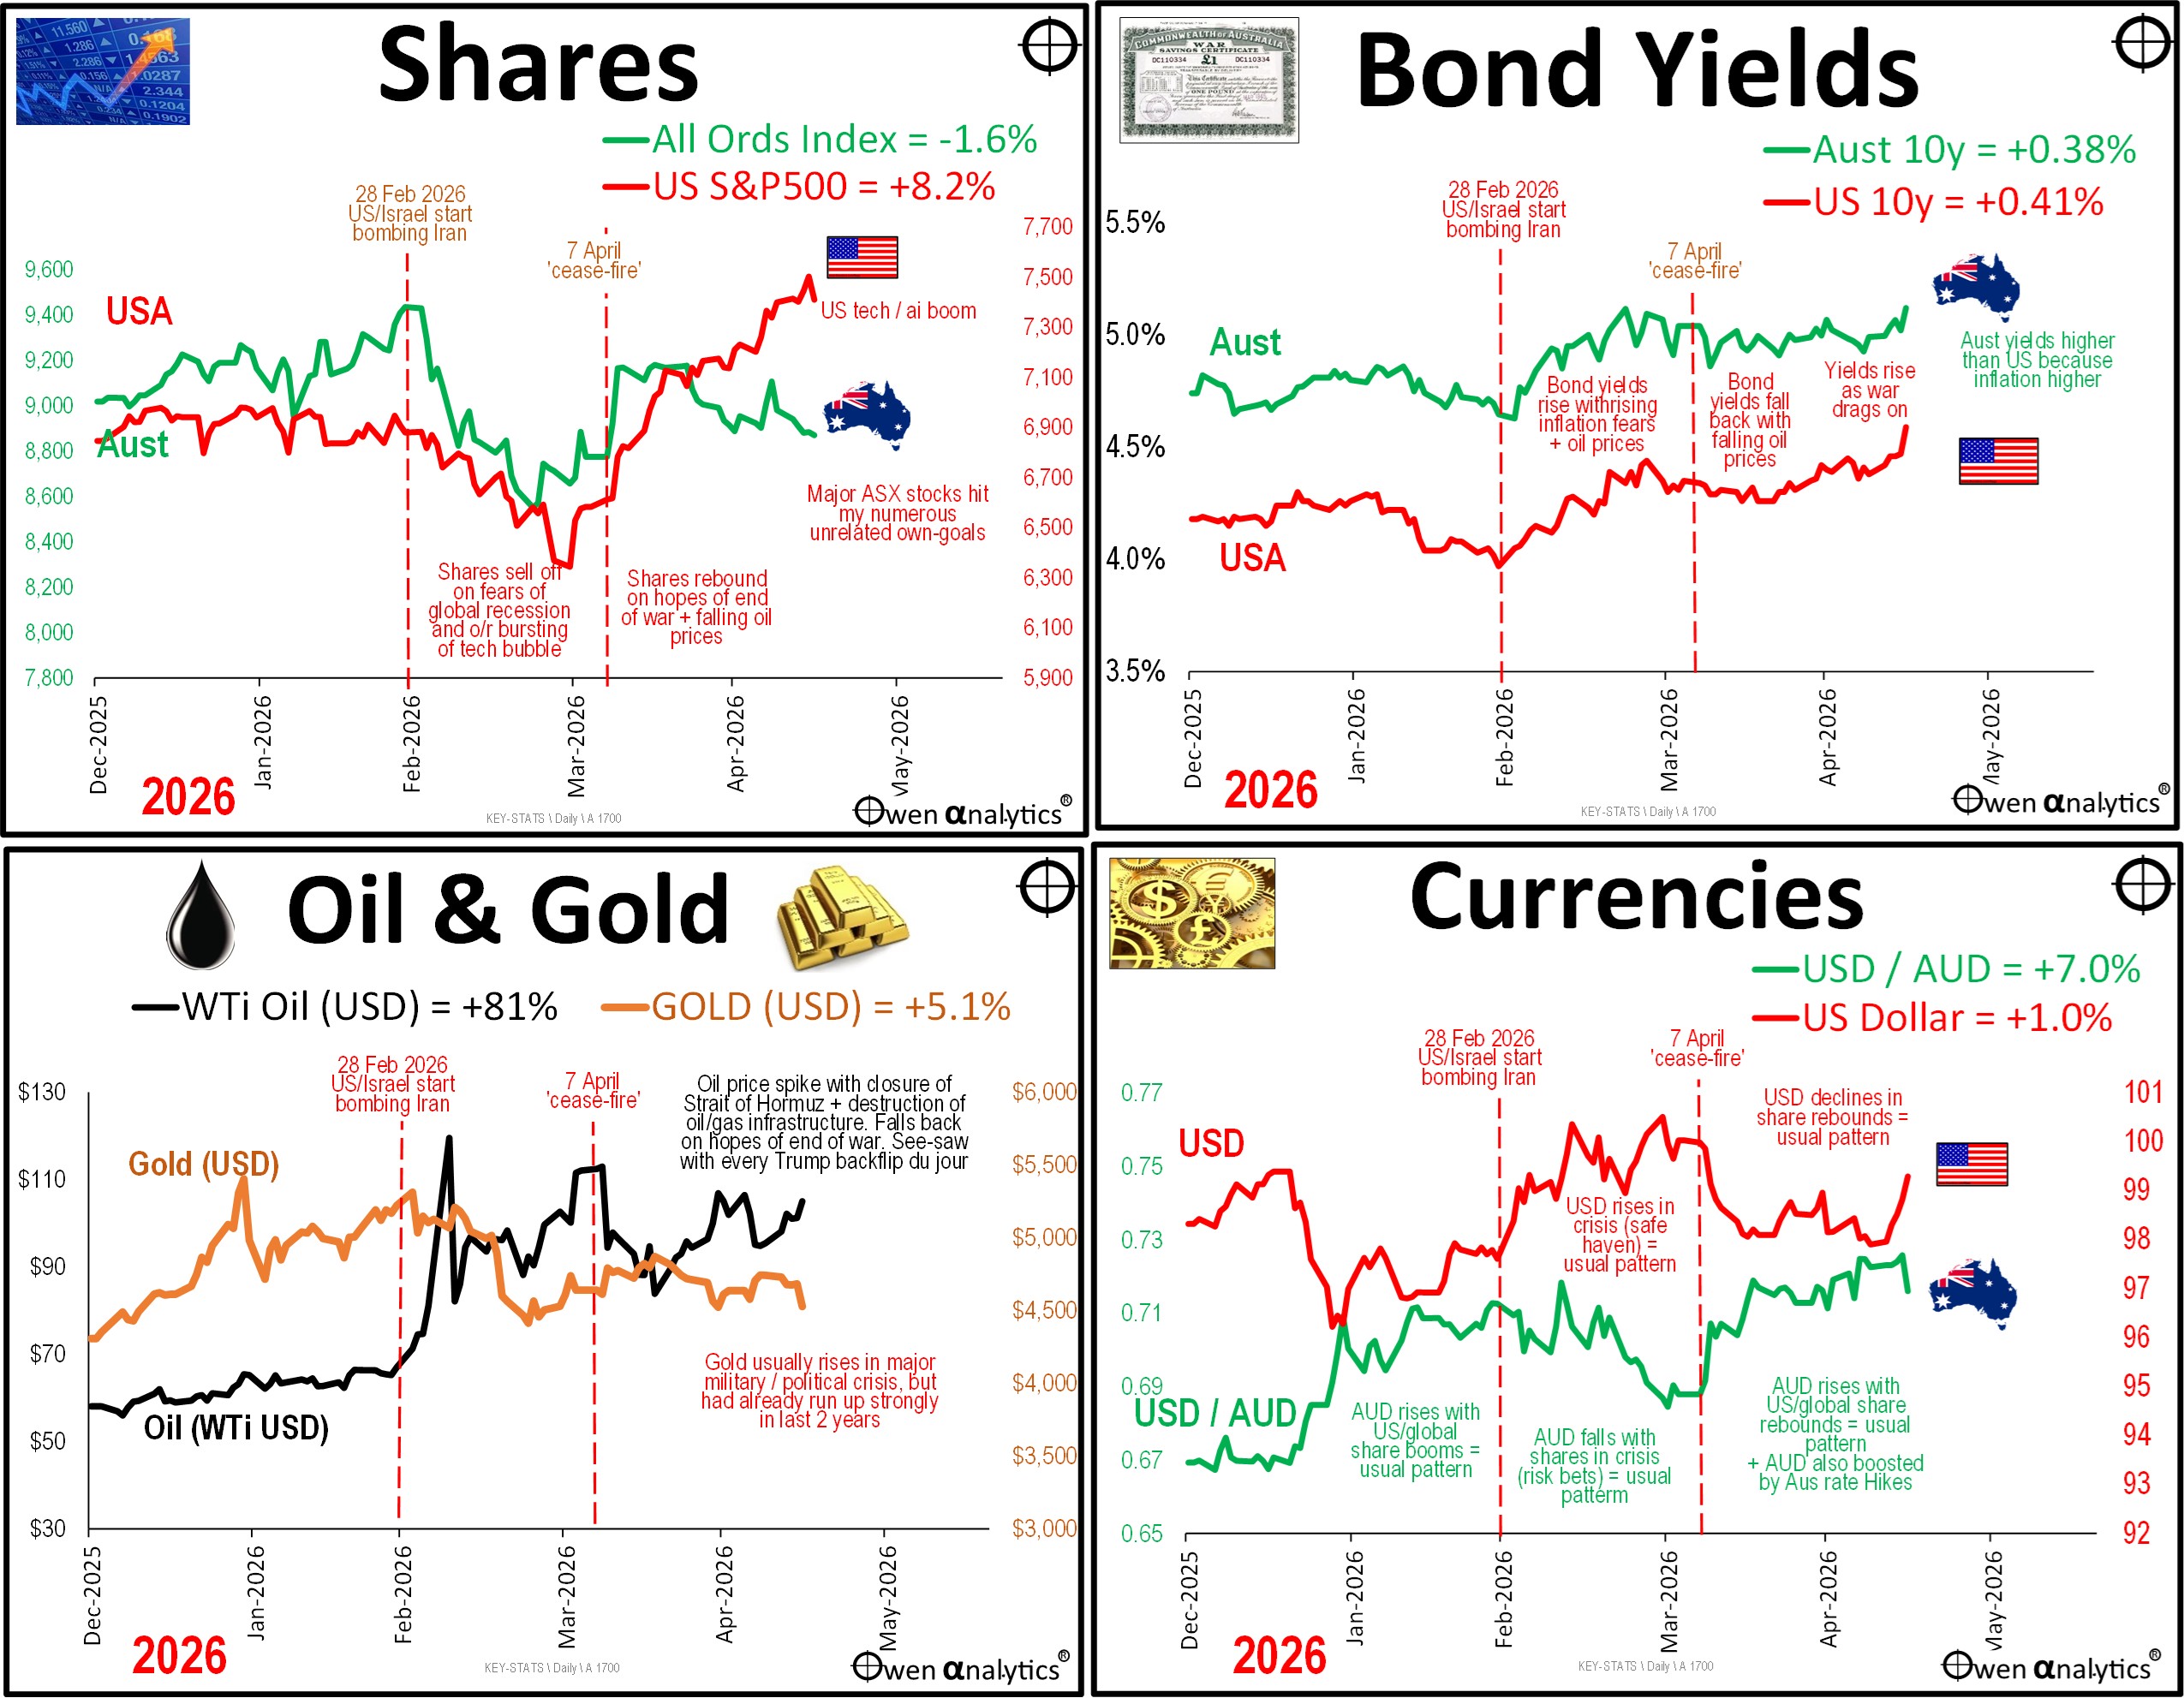
I track and analyse thousands of data points across all markets and asset classes, but the most important barometers and drivers of local and global markets for my purposes are: share markets (Aus & US), treasury bonds (Aus & US), currencies (AUD & USD), oil and gold.
Here they are from the start of 2026, with key events/dates highlighted:
Image failed to load
https://tlmrisuvienxdqwnjocl.supabase.co/storage/v1/object/public/oauploads/2026/16May/20260519-1b3161db-f3f8-4163-bc47-06d93e443e41.jpg
Check the URL is correct and the file exists in Supabase storage.
I aim to publish updates regularly (weekly at this stage) to complement my regular monthly reports.
Brief comments on the major markets:
Shares
- At the start of the war share markets everywhere sold off sharply. Then, from the beginning of April, shares started to rebound on signs of an early end to the war, and share markets kept rising after the 7 April ‘cease fire’ deal.
- Although the war has dragged on since then, with oil prices remaining high and inflation numbers rising across the world, US share prices have kept rising in the US-led tech / ai / chip boom. To Friday 16 May, the US S&P market has posted 18 new all-time highs for 2026 to date.
- While the US market has posted 7 new all-time highs so far in May, the All Ords has posted none (the last All Ords all-time high was 27 Feb and it has only posted 2 new all-time highs this year).
- The ASX market does have some big miners that are benefiting from the global supply disruptions and demand surges, but it has two main problems holding it back. First, it has almost no tech / ai / semiconductor stars. Second, a string of major local stocks have been by ‘own-goals’ – ie problems of their own making.
- The local health care sector in particular has been a sea of share slumps this year - including: CSL, Cochlear, ProMedicus, ResMed, Sonic. Most of these have been own goals – with aggressive expansion adventures failing to live up to the hype.
- Also hit hard this year have been several former tech stars for the same reason (overly ambitious expansion) plus also the threat of annihilation by ‘ai’ - including: Wisetech, Xero, Seek, CarSales, REA.
Bond yields
- Bond yields reflect expectations of future inflation and interest rates.
- At the start of the war, yields started rising in expectation that rising fuel prices would lead to higher general price inflation that would be met with interest rate hikes. After the 7 April ‘cease fire’, yields started falling in expectation of a resolution and lower oil prices.
- However, yields have been rising again since mid-late April as the war dragged on, the Strait of Hormuz remained largely closed, and oil prices remained high.
- Why they are important? Because rising bond yields mean lower prices and lower returns on fixed rate bonds. This is bad for long-term funds in Australia and globally, most of which are stacked full of bonds. Even if you are like me and hold no fixed rate bonds (have not since 2021), rising bond yields almost always trigger sell-offs in other assets including share markets and real estate.
Oil
- Oil prices shot up at the start of the war, then eased back on hopes of early resolution, but rose again from Mid-April on Iran’s closure of Strait of Hormuz and destruction of oil/gas infrastructure. Prices remain high as the war drags on with no end in sight.
- Elevated energy prices are feeding into inflation numbers rising everywhere, lifting bond yields (and ordinarily should be dampening share markets).
- Why is oil important? Because rising fuel prices filter directly or indirectly into just about every inflation category, and inflation expectations drive interest rate decisions, bond yields, which in turn affect the pricing of all other assets.
- NB: The chart shows ‘West Texas Intermediate’ (WTI) which is the main US price benchmark for oil. Also of interest is ‘Brent Crude’ for Europe (Brent is currently around $10 above WTI), or ‘Tapis Crude’ for Aian markets traded through Singapore, etc. For me WTI is a pretty good general barometer.
Currencies
- The US dollar is the global ‘safe haven’ currency (and has been since WW1). The USD almost always rises in general crises (even if the cause of the crisis is the US itself – eg the GFC), as global investors (mainly US) sell risky foreign assets and retreat to the safety of US cash or bonds. To do this they need to sell the foreign currency and buy US dollars, putting downward pressure on foreign currencies and upward pressure on the US dollar.
- Conversely, The US dollar almost always declines during rebounds and general rallies. When global investors (mainly US) are bullish, they venture overseas to buy risky foreign assets. To do this they have to sell US dollars and buy foreign currencies, putting downward pressure on the US dollar and upward pressure on the foreign currencies.
- The Aussie dollar is a ‘risky’ foreign currency, so it ALWAYS falls in general global sell-offs as global (mainly US) investors dump foreign risky assets and retreat to the safety of the US. Conversely, in general global rebounds and booms, the AUD usually (but not always) rises as foreign investors (mainly US) venture back in.
- From the start of the war, the US dollar rose and the AUD fell – as per the usual pattern.
- After the 7 April ‘cease fire’ deal, confidence return (briefly) so the US dollar fell back and the AUD rose -also the usual pattern. Also boosting the attractiveness of the AUD are the three interest rate hikes here this year.
- However, in recent days they have reversed again as hopes for lower oil prices and an end to the war fade – sending the US dollar higher and the AUD lower.
Gold
- Gold usually rises in major military / political crisis but in this crisis the price action has been subdued, as gold had already doubled in price in the 12 months leading up to the war.
- The biggest buyers of gold in recent years have been central banks, especially in countries non-aligned to the US (who is aligned to the US under Trump?). Rising prices sparked a frenzied retail FOMO-led peak at the end of January this year, but prices fell back early in the war.
- Gold prices have remained relatively flat at around levels seen in the first few weeks of the year.
- The gold price should be kept elevated, and/or rising given:
- (a) rising inflation due to high energy prices and possible prices-wages spiral;
- (b) likely continued elevated fuel prices given Trump’s inability to end the war he started;
- (c) possible reluctance of central banks to hike rates to fight inflation; and
- (d) signs of China possibly revisiting plans to invade Taiwan.
- (I put gold in long-term portfolios (my own + advised) a couple of years ago, and it has been the best asset class since then).
Stay tuned!
‘Till next time – happy investing and stay healthy!